Bitcoin Dominance: What the Ratio Measures
Understand Bitcoin’s share of a provider-defined crypto market, how supply and stablecoin choices affect it, and why it is not a standalone trading signal.
DTCC Trading Editorial

Bitcoin dominance measures a share of reported market capitalization. It can help describe how Bitcoin compares with a selected crypto market, but it does not directly measure money flowing between assets or determine what prices will do next. The calculation and its denominator matter.
The Basic Calculation
Bitcoin dominance divides Bitcoin’s market capitalization by the total cryptocurrency market capitalization included by a data provider, then multiplies by 100. In a hypothetical dataset where Bitcoin accounts for 2 units out of a total 4 units, its dominance is 50%.
The ratio can rise because Bitcoin gains faster than other included assets, falls less than they do, or because the composition and supply estimates change. The direction alone does not identify the cause.
Before interpreting a chart, identify the provider, asset universe and market-cap methodology. Different inclusion rules can produce different dominance values without either provider making a simple arithmetic error.
Relative Performance and Opportunity Cost
Comparing an asset with Bitcoin is one way to measure relative performance. It answers a different question from whether the asset gained in a local currency. Both can be useful, depending on the purpose of the comparison.
Dominance is an aggregate measure, however, and cannot tell you how one particular asset performed. Use that asset’s own return series over the same period and account for the costs of any actual transactions.
Commentary often associates dominance with changes in risk appetite. That is an interpretation to test, not a rule. Broader market conditions and changes in the denominator can produce similar-looking movements for different reasons.
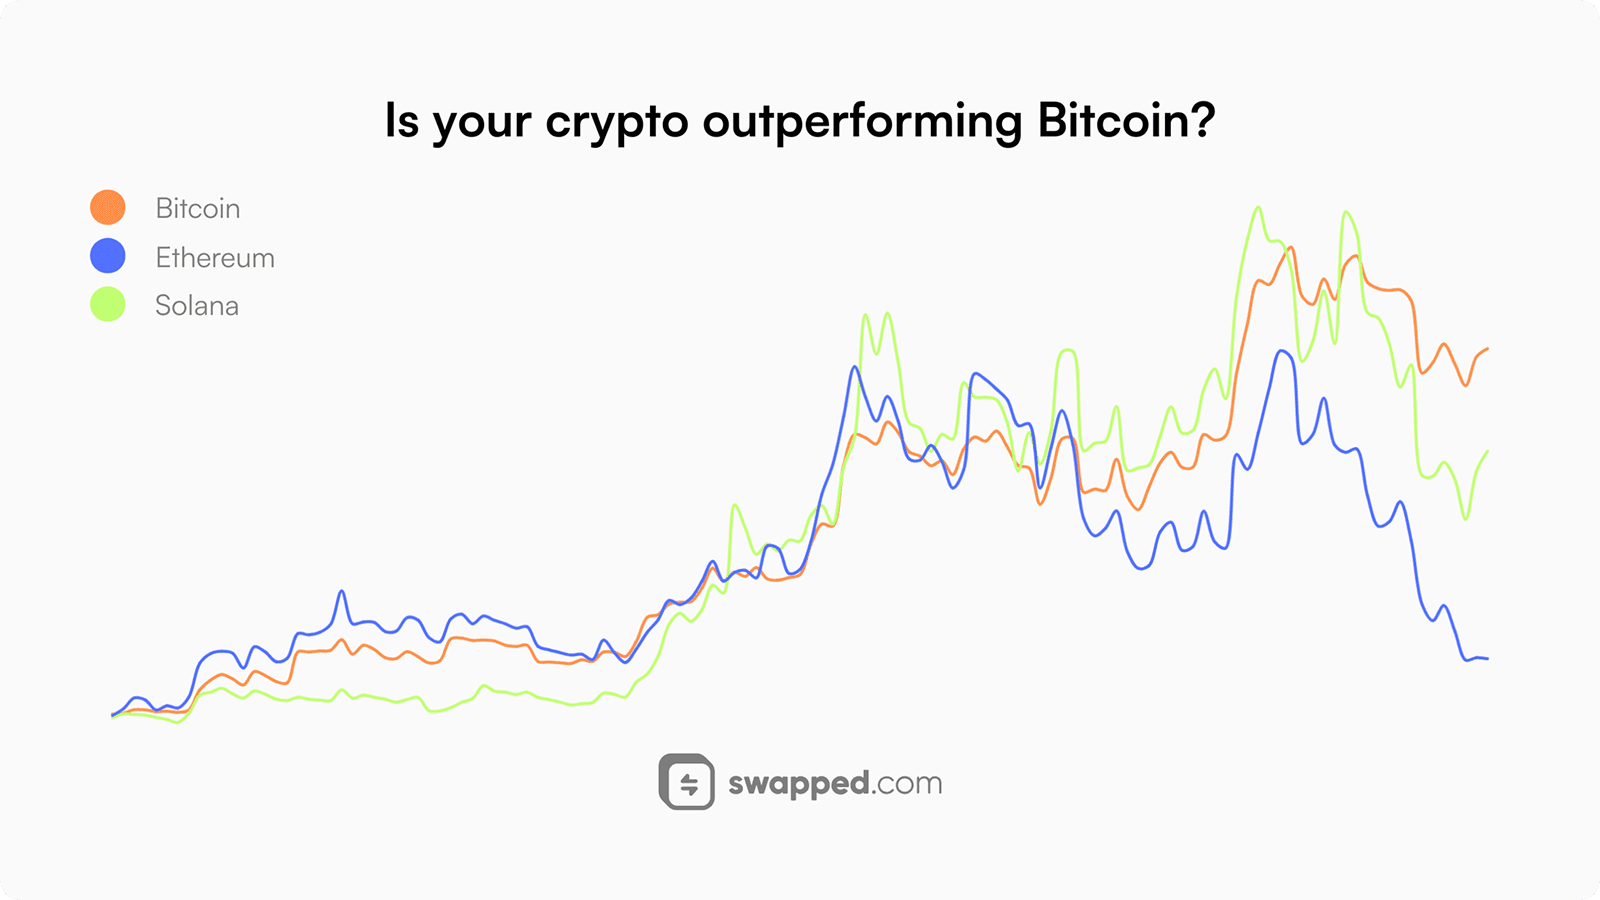
A gain in one quote currency does not necessarily mean outperformance against Bitcoin.
Dominance and Other Crypto Assets
A falling dominance ratio means Bitcoin’s share of the included market cap has declined. It does not prove that every other token is rising or that a broad altcoin rally has begun. Large components can drive the aggregate.
The phrase alt season also has multiple definitions. A measure based on how many assets outperform Bitcoin over a fixed period differs from a market-cap share. Read the methodology before treating the two as interchangeable.
Bitcoin’s price and dominance can rise together, fall together or move in opposite directions. The price measures Bitcoin against a quote currency; dominance measures Bitcoin against a changing collection of market capitalizations.
What the Ratio Does Not Say About Risk
Assets differ in liquidity, supply control, custody, contract design and economic purpose. Dominance does not summarize those exposures. A low share of the market can coexist with very different risks across individual tokens.
A broad rally can make weakly supported claims seem convincing. Evaluate a token’s current evidence and accessible liquidity independently of the market phase. Relative market share is not a security or quality certification.
Likewise, a rise in Bitcoin dominance does not guarantee that holding Bitcoin avoids losses. It can occur during a market decline if other included assets fall more sharply. Relative performance and positive returns are different outcomes.
Changing the Unit of Comparison
Expressing a portfolio in bitcoin or satoshis can reveal how it performed relative to Bitcoin. Expressing it in a local currency answers another question. Keep the same dates and include deposits and withdrawals when calculating returns.
A useful comparison also considers volatility, drawdowns, liquidity and costs. A higher nominal return over one chosen window does not establish that two portfolios carried equivalent exposure or met the same objective.
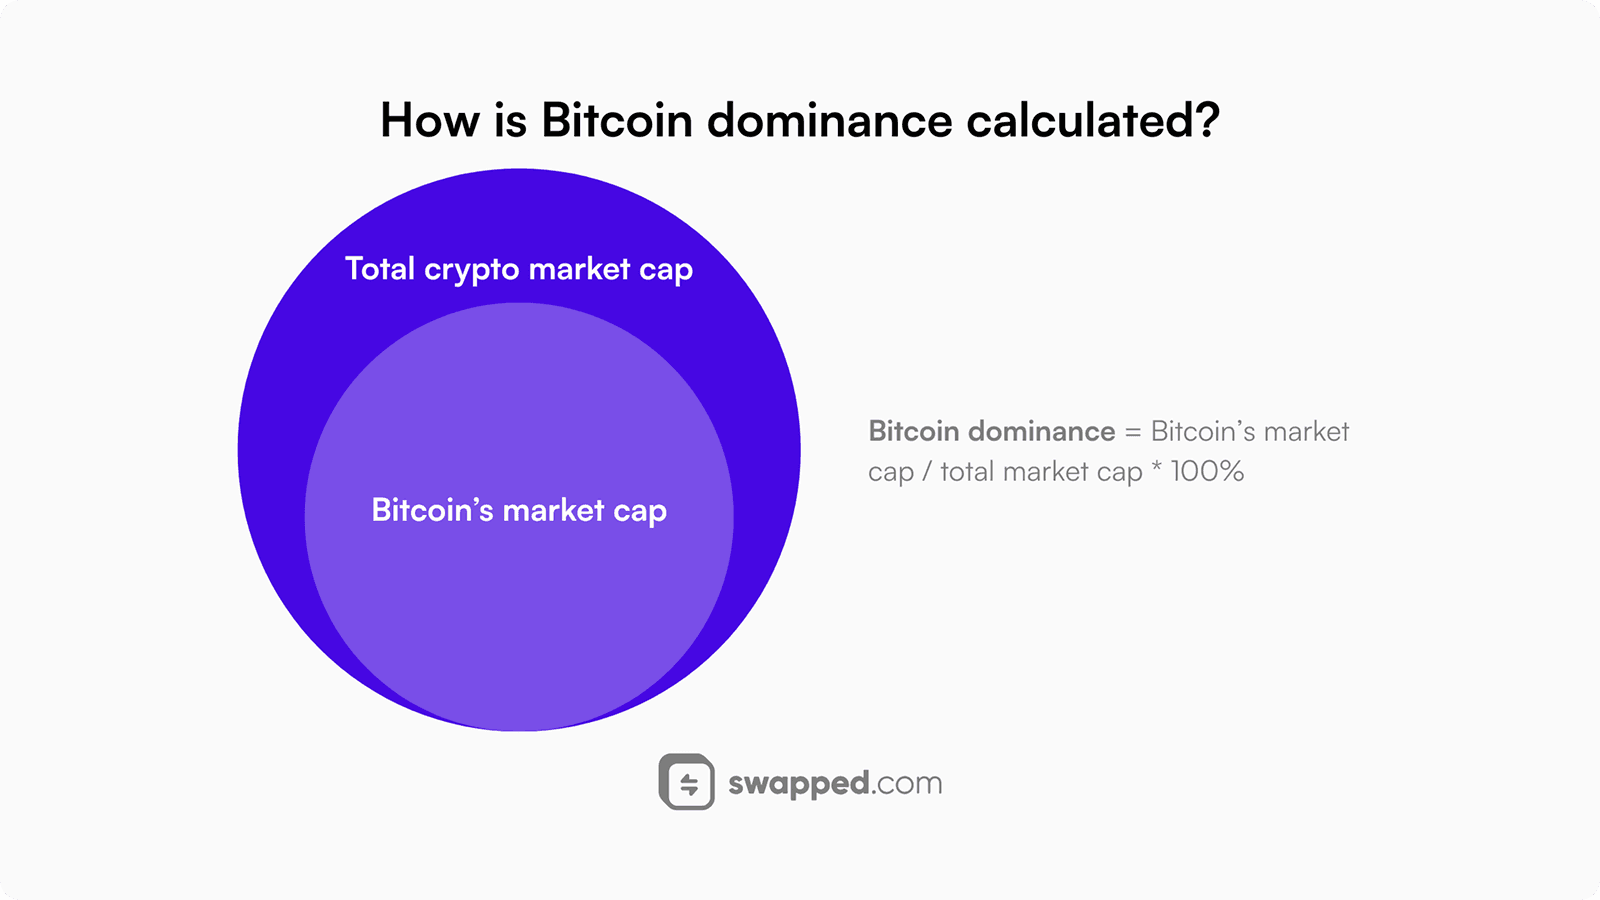
Dominance is a market-cap share calculated from a defined set of assets.
Reading Historical Dominance
Historical charts depend on which assets the provider tracked at each date and how their supply was estimated. The market universe changed as new assets appeared. A long chart is therefore not a comparison against a permanently fixed basket.
To study a past period, preserve the source, date range and any methodological notes. Avoid treating a remembered percentage as a universal historical fact when datasets can differ or revise their coverage.
This article does not provide a current dominance reading. Use a current data source for that figure and record the observation time. A live value should be separated from the general explanation of how the ratio works.
Monetary Conditions and Market Interpretation
Quantitative easing is a central-bank asset-purchase policy financed through central-bank reserves. It can affect financial conditions, but the path from a policy decision to a particular crypto ratio involves many other variables.
A chart showing dominance changing during a policy period does not establish causation. Expectations, asset issuance, regulation and market-specific events can also matter. State the evidence and uncertainty when proposing a macroeconomic explanation.
Stablecoins in the Denominator
Stablecoins can form part of a provider’s total crypto market capitalization. Their issuance and redemption can therefore change the denominator even without a comparable change in speculative token prices. This applies across blockchain environments, including Ethereum.
Some alternative ratios exclude stablecoins or other categories. That can be useful for a specific question, but it creates a different metric. Label the adjusted denominator clearly instead of presenting it as the same dominance series.
Interpreting Sudden Changes
A sharp move deserves inspection of both numerator and denominator. Check Bitcoin’s price and supply input, the largest other components and any dataset changes. A sudden ratio movement is not automatically a forecast of market volatility.
Patterns that look persuasive after the fact need testing across a defined sample, including failures. Selecting a few memorable turning points can make an unreliable relationship appear dependable.
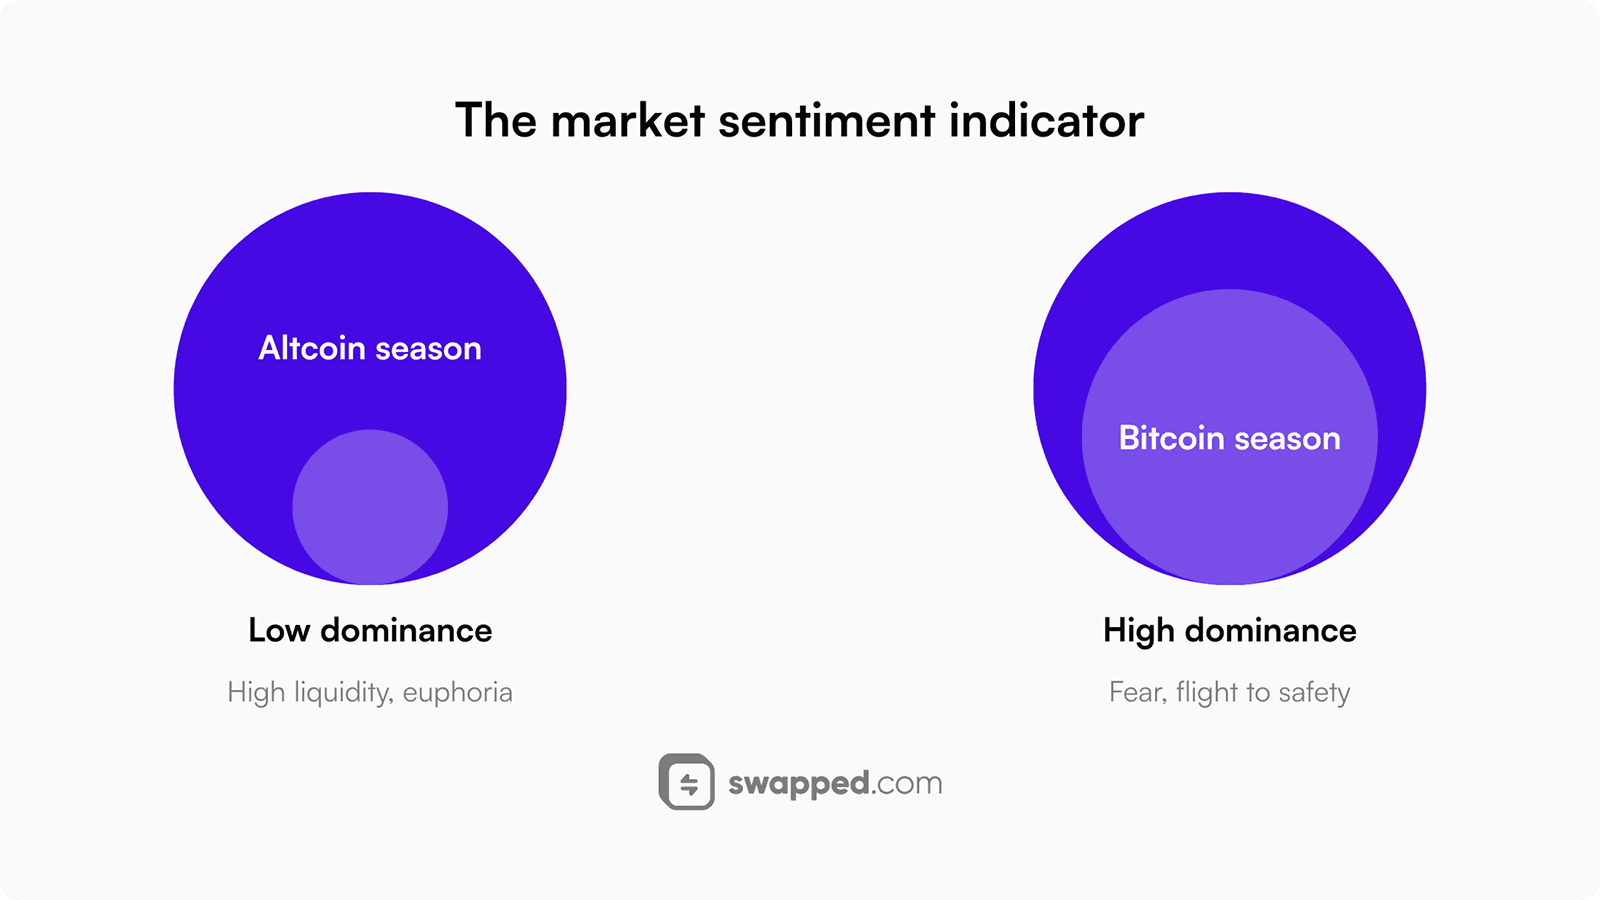
Dominance can inform market description, but sentiment and future direction require separate evidence.
Using the Metric in Research
Use dominance to frame a question, such as whether reported market value became more concentrated in Bitcoin during a period. Then inspect the components and relevant price series. The ratio alone does not prescribe a portfolio rotation.
Keeping the Analysis in Scope
Combine the ratio with information relevant to the actual decision, including costs, liquidity and the asset’s structure. A market-wide statistic cannot replace a review of personal circumstances or a specific instrument.
Longer-Term Interpretation
There is no rule requiring dominance to rise or fall indefinitely. The result depends on relative prices, supply estimates and the composition of the measured market. Future values are uncertain.
Adding more token names to a dataset does not mechanically guarantee a large reduction in Bitcoin’s share. Their included market capitalizations and the treatment of overlapping assets determine the arithmetic effect.
A Ratio With Clear Boundaries
Bitcoin dominance is useful when its definition is kept visible. It describes relative reported market value within a dataset, while leaving questions about ownership, capital flows and future performance unresolved.
Begin with the denominator, compare consistent periods and explain alternative causes of a change. This produces a more reliable analysis than treating one chart as a complete map of the crypto market.
Related Reading
The linked explainers discuss different interpretations. Compare their definitions and data sources before combining figures or applying a historical pattern to a new period.