Bitcoin dominance measures Bitcoin’s share of a defined crypto market capitalization total. The result depends on prices, supply estimates and the assets included in the comparison.
Bitcoin dominance is a market-share measure based on capitalization. It compares Bitcoin’s estimated market capitalization with a selected total for crypto assets. It describes that relationship at a point in time; it does not directly measure investor confidence or money entering Bitcoin.
What the Percentage Means
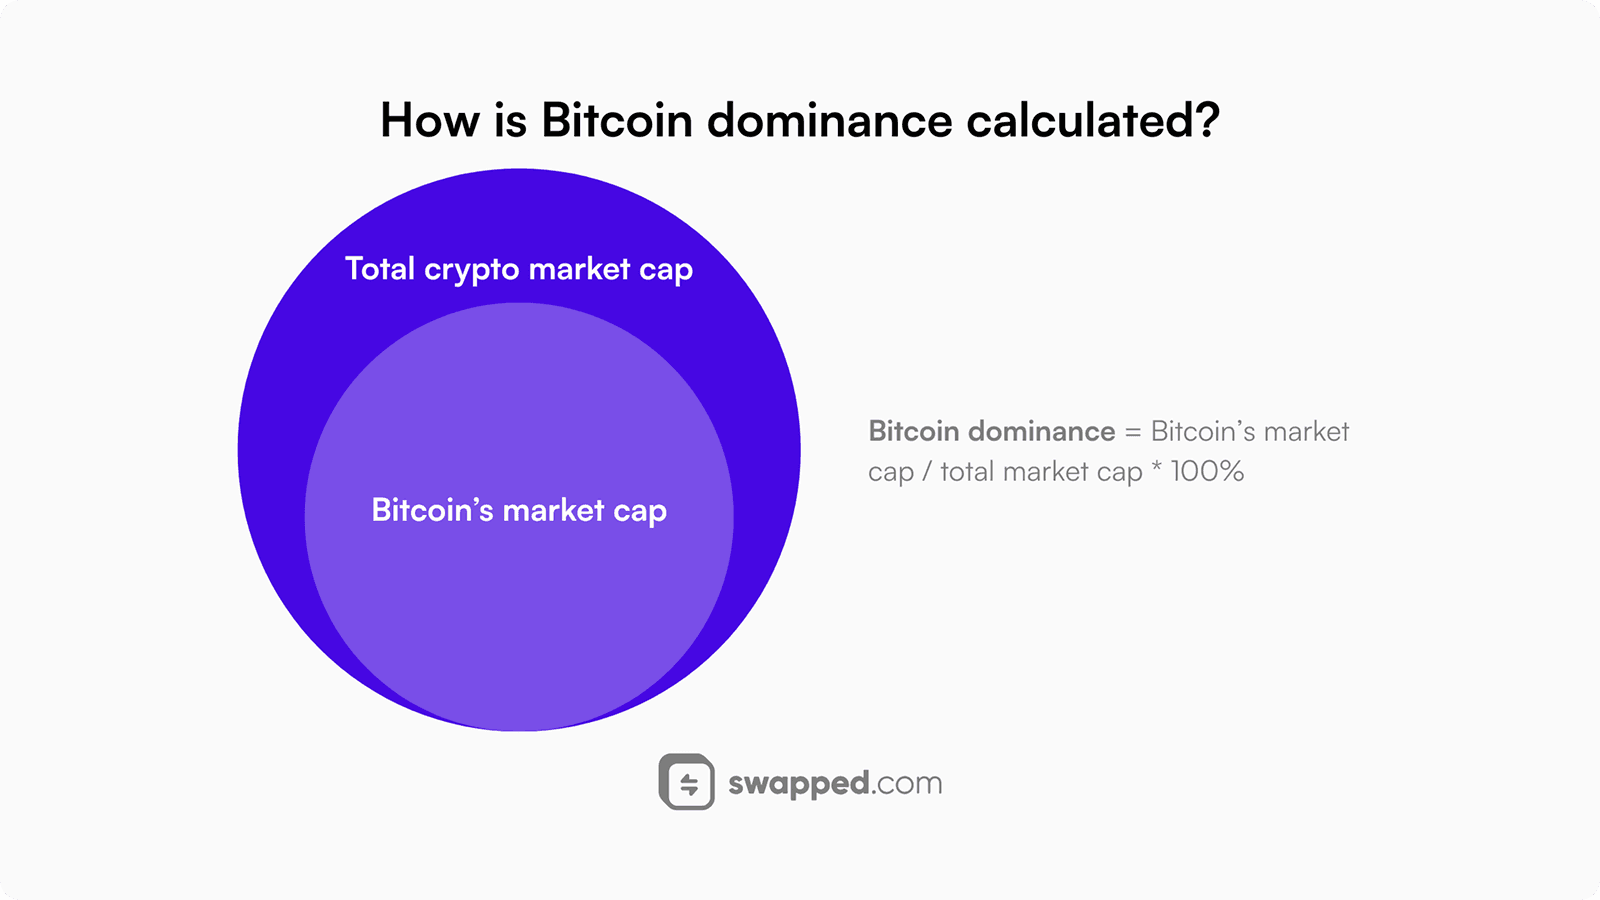
The basic calculation divides Bitcoin market capitalization by the chosen aggregate market capitalization and multiplies by one hundred. The denominator matters: different providers can include different assets or apply different supply verification rules.
For a hypothetical example, a Bitcoin capitalization of 600 units in a crypto total of 1,000 units produces 60 percent dominance. The example illustrates the ratio only and is not a current market reading.
Market capitalization is usually built from a price and a supply estimate. It is not a cash balance available for withdrawal. A change in capitalization therefore should not automatically be described as the same amount of money flowing into or out of the asset.
Why the Measure Changes
Dominance changes when the numerator and denominator change at different rates. Price movements are one cause; supply revisions, new assets and changes in provider coverage can also alter the comparison.
Relative Price Movements
If Bitcoin rises faster than the other included assets, its share can increase. It can also increase while Bitcoin falls if the rest of the measured market falls more. The direction of the ratio alone does not tell you whether Bitcoin’s price rose.
Likewise, falling dominance can accompany a rising Bitcoin price when other included assets grow faster. Read both the share and the absolute market values to describe the observed movement accurately.
The comparison period needs to be consistent. A dominance change over one day and a Bitcoin return over one month are not directly aligned observations. Record timestamps and the provider when comparing charts or commentary.
Bitcoin’s market share and Bitcoin’s absolute price answer different questions.
Supply and Coverage Changes
A provider’s circulating supply estimate influences each asset’s market capitalization. Revisions to those estimates or the addition of newly tracked assets can change the total even without equivalent price movements across existing assets.
Stablecoins and wrapped assets can also affect how a total is interpreted. Check whether the particular chart includes them and how it avoids or handles overlapping representations. Do not assume every dominance chart has the same denominator.
Using Dominance as Market Context
The measure can help describe how capitalization is distributed across a market dataset. It is most useful alongside a clear statement of the dataset’s scope and the time period being examined.
It does not tell you why a participant bought or sold, how much liquidity is available or whether an individual asset is safe. Those questions require different evidence from the market-share ratio.
Connections With Altcoin Performance
A decrease in Bitcoin’s share can coincide with broad non-Bitcoin outperformance, but the two observations are not identical. An altcoin breadth measure may count assets equally while dominance gives weight through capitalization.
A few large assets can change the aggregate ratio while many smaller assets behave differently. Inspect the distribution of returns before concluding that a dominance movement represents the same experience across the whole market.
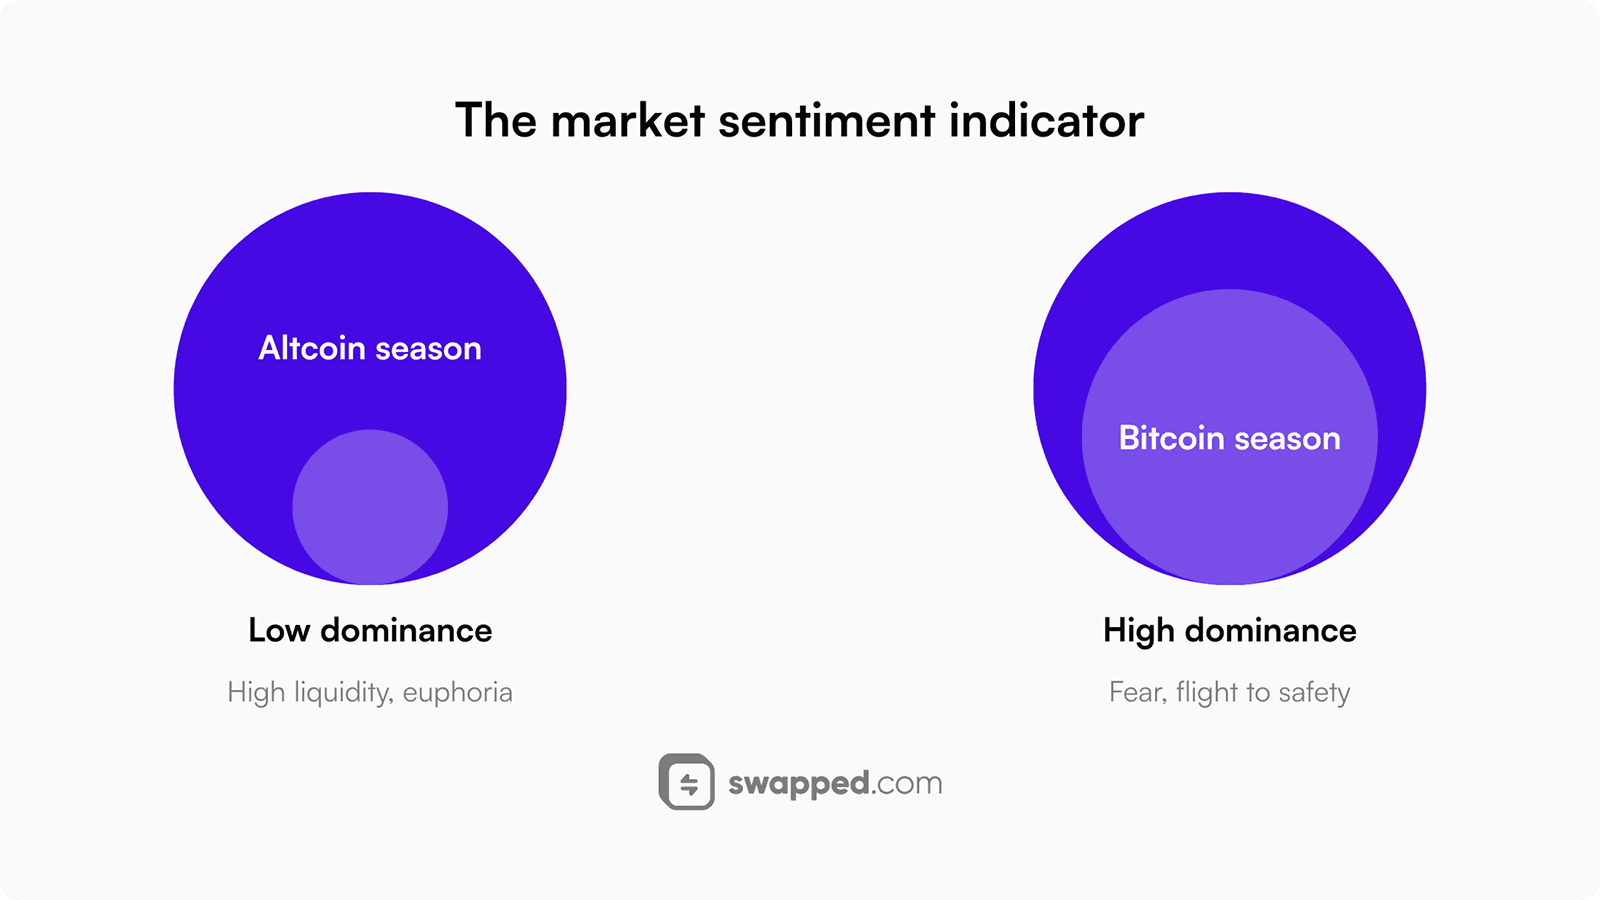
A market-wide ratio can hide substantial differences among individual assets.
Avoid Automatic Trading Rules
There is no universal dominance level that establishes what to buy, sell or expect next. A threshold used in one historical analysis may not transfer to another market composition or measurement method.
A historical association is also different from a causal explanation. If dominance and another metric move together, examine their shared inputs and the selected period before claiming that one predicts the other.
Read and Report the Metric Clearly
Use the same provider and definition for comparisons through time. Note any methodology change that could break continuity. If a chart’s calculation cannot be established, present the reading as provider-reported rather than universally definitive.
A concise report should include the observation date, dominance value, relevant change and the measured universe. Add Bitcoin’s absolute performance when the purpose is to explain market direction rather than market composition alone.
For research, distinguish a current observation from a forecast. The ratio can summarize what the selected data shows; a forecast needs additional assumptions and evidence that can be evaluated separately.
DTCC Trading includes Bitcoin dominance as a market literacy concept. This definition does not supply a live reading, a trading signal or a statement that Bitcoin or any other listed asset is available through the platform.
Related Concepts
FAQs about Bitcoin Dominance
What counts as high Bitcoin dominance?
High is relative to a chosen historical period and dataset. There is no universal threshold with a fixed market implication. Compare readings from the same provider and methodology, and state the reference period instead of treating one percentage as a general trading rule.